Question:
Study the given table and answer the question that follows. The table shows the number of students in various courses in various cities A, B, C, D and E in India during the academic year 2022-2023. What was the average number of students in Science course in all the cities altogether during the academic year 2022-2023?
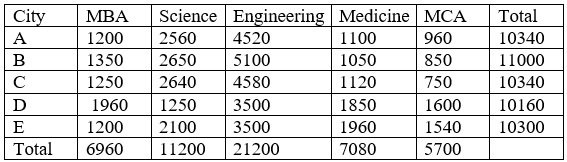
दी गई तालिका का अध्ययन करें और नीचे दिए गए प्रश्न का उत्तर दें। तालिका शैक्षणिक वर्ष 2022-2023 के दौरान भारत के विभिन्न शहरों A, B, C, D और E में विभिन्न पाठ्यक्रमों में छात्रों की संख्या को दर्शाती है। शैक्षणिक वर्ष 2022-2023 के दौरान सभी शहरों को मिलाकर विज्ञान (Science) पाठ्यक्रम में छात्रों की औसत संख्या कितनी थी?
Options:
- a) 2220
- b) 2200
- c) 2250
- d) 2240
- a) 2220
- b) 2200
- c) 2250
- d) 2240
correct answer : d)
Explanation:
From the table, the number of Science students in cities A, B, C, D, and E are 2560, 2650, 2640, 1250, and 2100 respectively. Total Science students = 2560 + 2650 + 2640 + 1250 + 2100 = 11200. Average number of students = 11200 / 5 = 2240.
तालिका से, शहरों A, B, C, D और E में विज्ञान के छात्रों की संख्या क्रमशः 2560, 2650, 2640, 1250 और 2100 है। कुल विज्ञान के छात्र = 2560 + 2650 + 2640 + 1250 + 2100 = 11200। छात्रों की औसत संख्या = 11200 / 5 = 2240।