Question:
The given bar graph shows the recruitment of employees in different years of a particular department. The percentage increase in the recruitment of employees from 2017 to 2018 is:
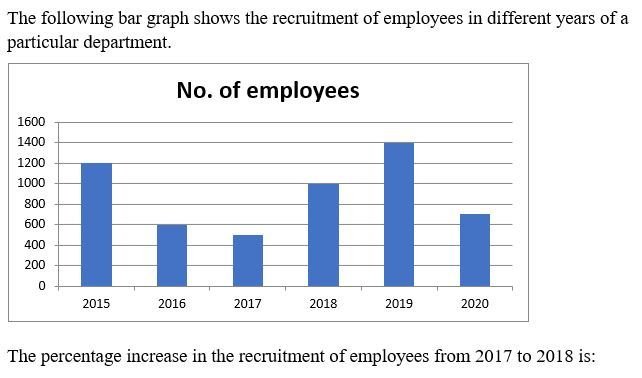
दिया गया बार ग्राफ एक विशेष विभाग के विभिन्न वर्षों में कर्मचारियों की भर्ती को दर्शाता है। 2017 से 2018 तक कर्मचारियों की भर्ती में प्रतिशत वृद्धि है:
Options:
- a) 150%
- b) 130%
- c) 100%
- d) 120%
- a) 150%
- b) 130%
- c) 100%
- d) 120%
correct answer : c)
Explanation:
From the bar graph: Recruitment in 2017 = 500. Recruitment in 2018 = 1000. Increase in recruitment = 1000 – 500 = 500. Percentage increase = (500 / 500) * 100% = 100%.
बार ग्राफ से: 2017 में भर्ती = 500। 2018 में भर्ती = 1000। भर्ती में वृद्धि = 1000 – 500 = 500। प्रतिशत वृद्धि = (500 / 500) * 100% = 100%।