Question:
The percentage distribution of the number of tires of different brands produced in a year by a certain factory is shown in the given pie chart. The total number of tires sold is 1350.
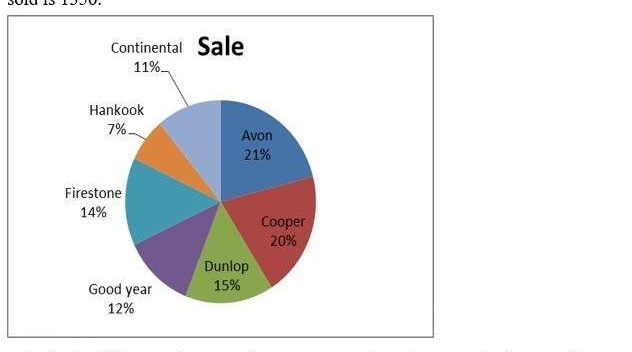
What is the difference between the average number of Avon and Firestone tires sold together and the average number of Good year and Dunlop tires sold together?
एक कारखाने द्वारा एक वर्ष में उत्पादित विभिन्न ब्रांडों के टायरों की संख्या का प्रतिशत वितरण दिए गए पाई चार्ट में दर्शाया गया है। बेचे गए टायरों की कुल संख्या 1350 है।
Avon और Firestone टायरों की औसत संख्या तथा Good year और Dunlop टायरों की औसत संख्या के बीच क्या अंतर है?
Options:
- a) 55
- b) 54
- c) 46
- d) 45
- a) 55
- b) 54
- c) 46
- d) 45
correct answer : b)
Explanation:
Total tires sold = 1350.
From the pie chart:
• Avon = 21% of 1350 = 0.21 × 1350 = 283.5
• Firestone = 14% of 1350 = 0.14 × 1350 = 189
• Good year = 12% of 1350 = 0.12 × 1350 = 162
• Dunlop = 15% of 1350 = 0.15 × 1350 = 202.5
Average of Avon and Firestone = (283.5 + 189) ÷ 2 = 472.5 ÷ 2 = 236.25
Average of Good year and Dunlop = (162 + 202.5) ÷ 2 = 364.5 ÷ 2 = 182.25
Difference = 236.25 − 182.25 = 54
बेचे गए कुल टायर = 1350.
पाई चार्ट से:
• Avon = 1350 का 21% = 0.21 × 1350 = 283.5
• Firestone = 1350 का 14% = 0.14 × 1350 = 189
• Good year = 1350 का 12% = 0.12 × 1350 = 162
• Dunlop = 1350 का 15% = 0.15 × 1350 = 202.5
Avon और Firestone का औसत = (283.5 + 189) ÷ 2 = 472.5 ÷ 2 = 236.25
Good year और Dunlop का औसत = (162 + 202.5) ÷ 2 = 364.5 ÷ 2 = 182.25
अंतर = 236.25 − 182.25 = 54