Question:
Study the given graph and answer the question that follows.
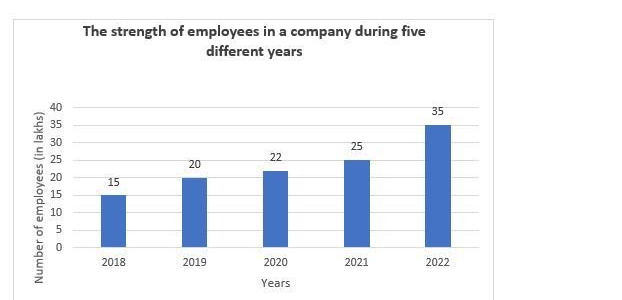
The following bar graph shows the strength of employees (in lakhs) in a company during five different years.
What was the percentage increase in employees in 2022 over 2019?
दिए गए ग्राफ का अध्ययन करें और उसके बाद आने वाले प्रश्न का उत्तर दें।
निम्नलिखित बार ग्राफ पांच अलग-अलग वर्षों के दौरान एक कंपनी में कर्मचारियों की संख्या (लाख में) को दर्शाता है।
2019 की तुलना में 2022 में कर्मचारियों की संख्या में कितने प्रतिशत की वृद्धि हुई?
Options:
- a) 70%
- b) 75%
- c) 25%
- d) 20%
- a) 70%
- b) 75%
- c) 25%
- d) 20%
correct answer : b)
Explanation:
Employees strength in 2019 = 20 lakhs.
Employees strength in 2022 = 35 lakhs.
Increase in employees = 35 − 20 = 15 lakhs.
Percentage increase = (15 / 20) × 100% = 75%.
2019 में कर्मचारियों की संख्या = 20 लाख।
2022 में कर्मचारियों की संख्या = 35 लाख।
कर्मचारियों की संख्या में वृद्धि = 35 − 20 = 15 लाख।
प्रतिशत वृद्धि = (15 / 20) × 100% = 75%.