Question:
Study the given pie-charts and answer the question that follows.
The pie-charts show the data of students’ progress after graduation.
Which two combined have the same number of students as the other?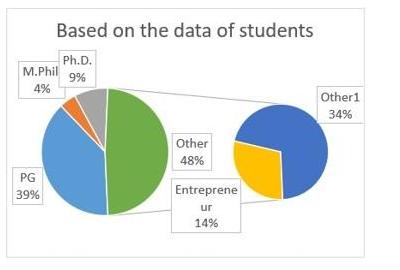
The pie-charts show the data of students’ progress after graduation.
Which two combined have the same number of students as the other?
दिए गए पाई-चार्ट का अध्ययन करें और नीचे दिए गए प्रश्न का उत्तर दें।
पाई-चार्ट स्नातक के बाद छात्रों की प्रगति का डेटा दिखाते हैं।
किन दो श्रेणियों के संयुक्त छात्रों की संख्या अन्य श्रेणी के बराबर है?
पाई-चार्ट स्नातक के बाद छात्रों की प्रगति का डेटा दिखाते हैं।
किन दो श्रेणियों के संयुक्त छात्रों की संख्या अन्य श्रेणी के बराबर है?
Options:
- P.G. + M.Phil.
- Entrepreneur + Ph.D.
- Entrepreneur + P.G.
- P.G. + Ph.D.
- P.G. + M.Phil.
- उद्यमी + Ph.D.
- उद्यमी + P.G.
- P.G. + Ph.D.
Correct Answer: d)
Explanation:
From the pie chart:
– P.G. = 39%
– Ph.D. = 9%
– Other = 48%
Combining P.G. and Ph.D.: \(39\% + 9\% = 48\%\), which equals the percentage of students in the ‘Other’ category (48%).
Hence, option (d) is correct.
पाई चार्ट के अनुसार:
– P.G. = 39%
– Ph.D. = 9%
– अन्य (Other) = 48%
P.G. और Ph.D. को जोड़ने पर: \(39\% + 9\% = 48\%\), जो ‘अन्य’ (Other = 48%) श्रेणी के बराबर है।
अतः विकल्प (d) सही उत्तर है।